mindmap
  root((🏛️ Nordic<br/>Statistics))
    💰 Tax & Revenue
      📊 Alcohol Tax Trends
      🏦 Government Income
      📋 Policy Signals
    👥 Demographics
      📈 Population Projections
      🎂 Age Distribution
      📐 Market Sizing
    🛒 Consumer Behavior
      🍷 Drinking Frequency
      🎓 Education Correlation
      🗺️ Regional Patterns
    🚢 Trade Data
      🇮🇹 Import by Country
      📦 Export Trends
      🔍 Competitive Intel
10 Nordic Statistics: Market Intelligence
10.0.1 📊 Beyond Sales Data: Government Statistics for Strategic Decisions
As a brand manager, you already have detailed sales data in SalesVP. The Nordic Statistics MCP gives you access to something different: macro-level government data that helps you understand market context, forecast demand, and make strategic decisions.
This chapter shows you how to extract intelligence from official statistics bureaus across the Nordics.
10.1 What is Nordic Statistics MCP?
The Nordic Statistics MCP server connects you directly to official government statistics from five Nordic countries:
| Region | Bureau | Language | Coverage |
|---|---|---|---|
| 🇳🇴 SSB | Statistics Norway | Norwegian/English | 1851-present |
| 🇸🇪 SCB | Statistics Sweden | Swedish/English | Varies |
| 🇫🇮 StatFI | Statistics Finland | Finnish/English | Varies |
| 🇩🇰 DST | Statistics Denmark | Danish/English | Varies |
| 🇮🇸 Hagstofa | Statistics Iceland | Icelandic/English | Varies |
Tip💡 Key Insight
This data is complementary to your SalesVP data. While SalesVP tells you what sold, Nordic Statistics tells you why it sold and what might sell in the future.
10.2 Strategic Data Categories
For a wine/spirits brand manager, the most valuable data falls into four categories:
10.3 1. Alcohol Tax Revenue: Policy Signals
Table 07107: Enkelte større inntektsposter i statsregnskapet
Code 13: Produktavgift på alkohol (Alcohol Product Tax)
Period: Monthly from 1980
Updated: Monthly
10.3.1 Why This Matters
The Norwegian government collects billions in alcohol tax. Tracking this helps you:
- Predict policy changes: Rising revenue → less pressure to increase taxes
- Understand seasonality: Which months generate most tax (= most consumption)
- Track market size: Tax revenue is a proxy for total market volume
10.3.2 Real Data: Monthly Alcohol Tax Revenue 2021-2025
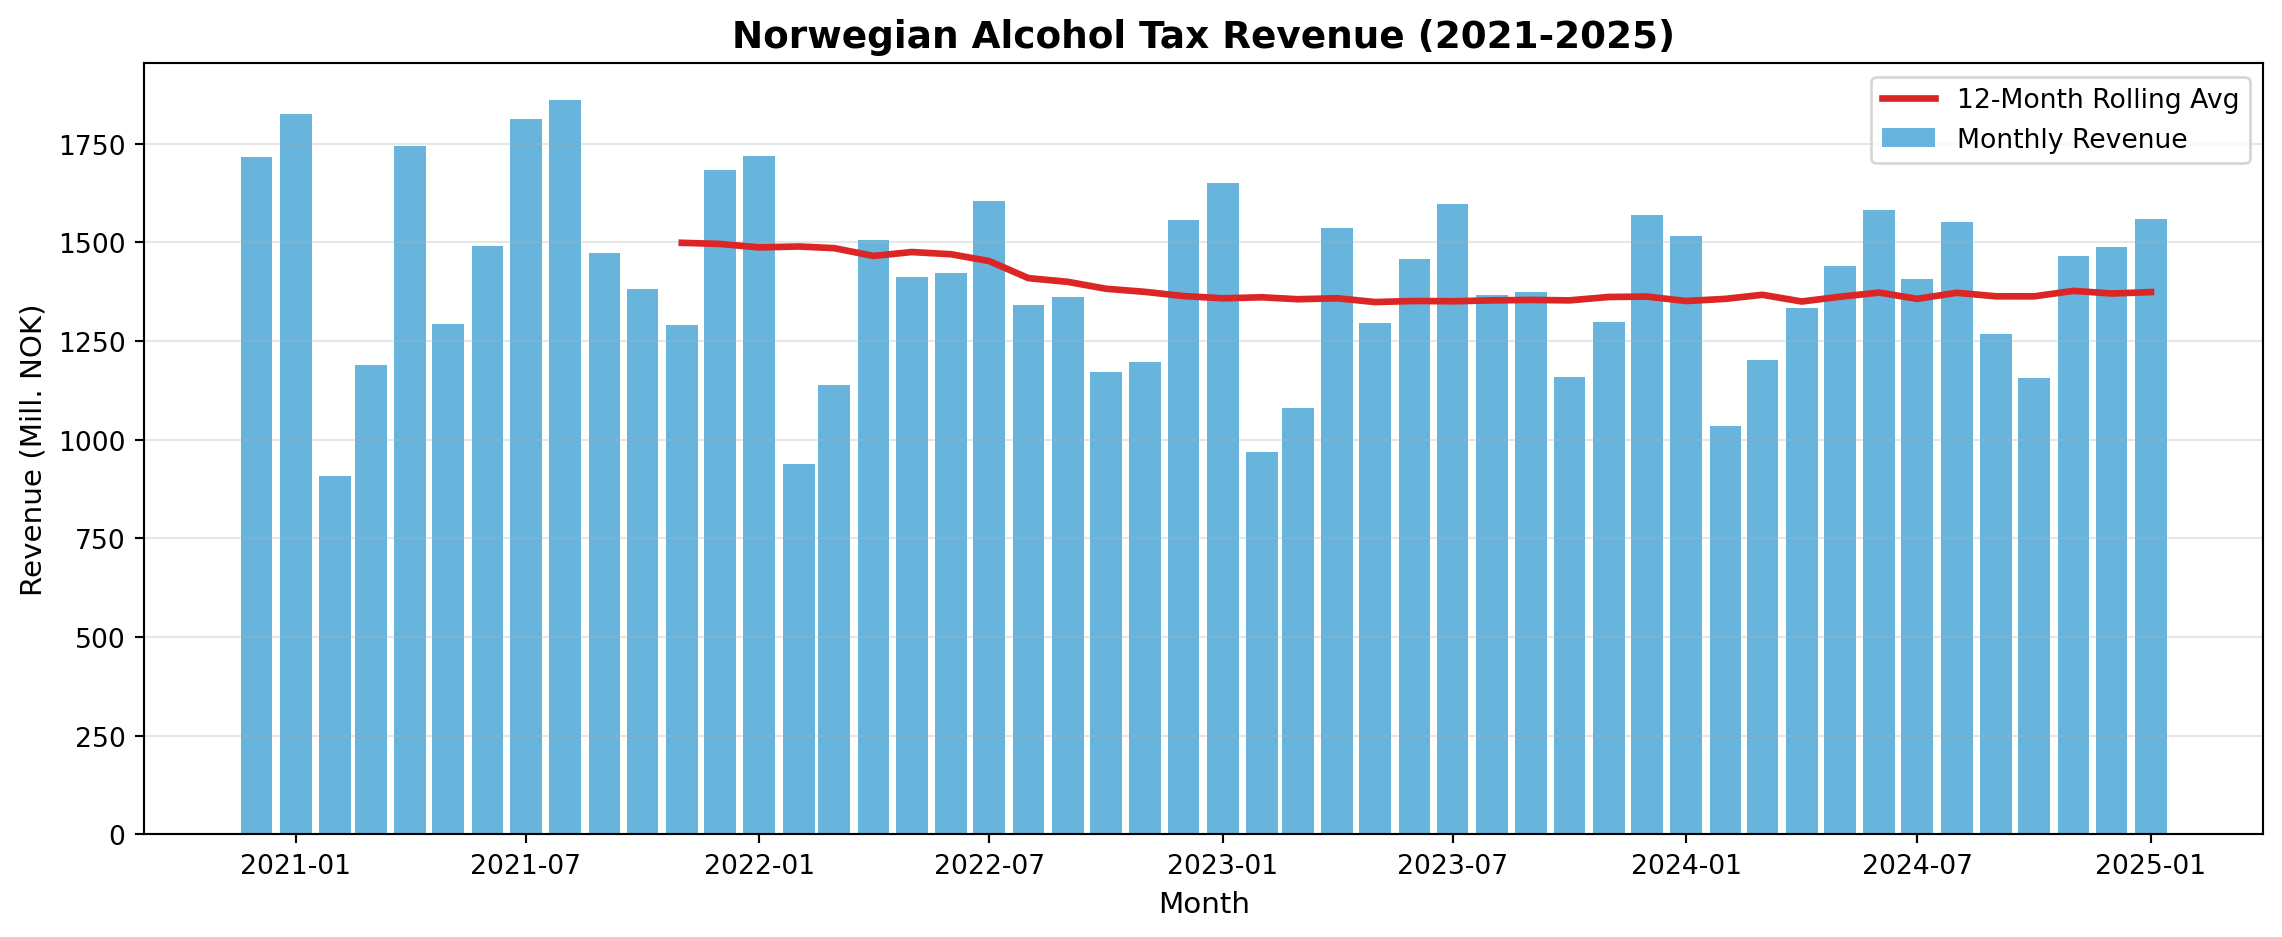
10.3.3 🔍 Pattern Discovery
December Peaks: Every December shows elevated tax revenue (Christmas consumption).
February Dips: February consistently shows the lowest monthly revenue.
Summer Surge: July-August show strong numbers (grilling season, tourism).
Strategic Action: Plan inventory and promotions around these predictable cycles.
10.3.4 Try It Yourself
10.4 2. Population Projections: Future Market Size
Table 13599: Framskrevet folkemengde 1. januar
Period: Projections from 2022 to 2100
Scenarios: 15 alternatives (high/medium/low growth)
By: Age, gender, immigration background
10.4.1 Why This Matters
Wine consumption correlates strongly with age. The core market is typically 35-65 year olds. SSB projects how this demographic will change through 2100.
10.4.2 Real Data: Norway’s Wine-Drinking Demographics 2025-2040
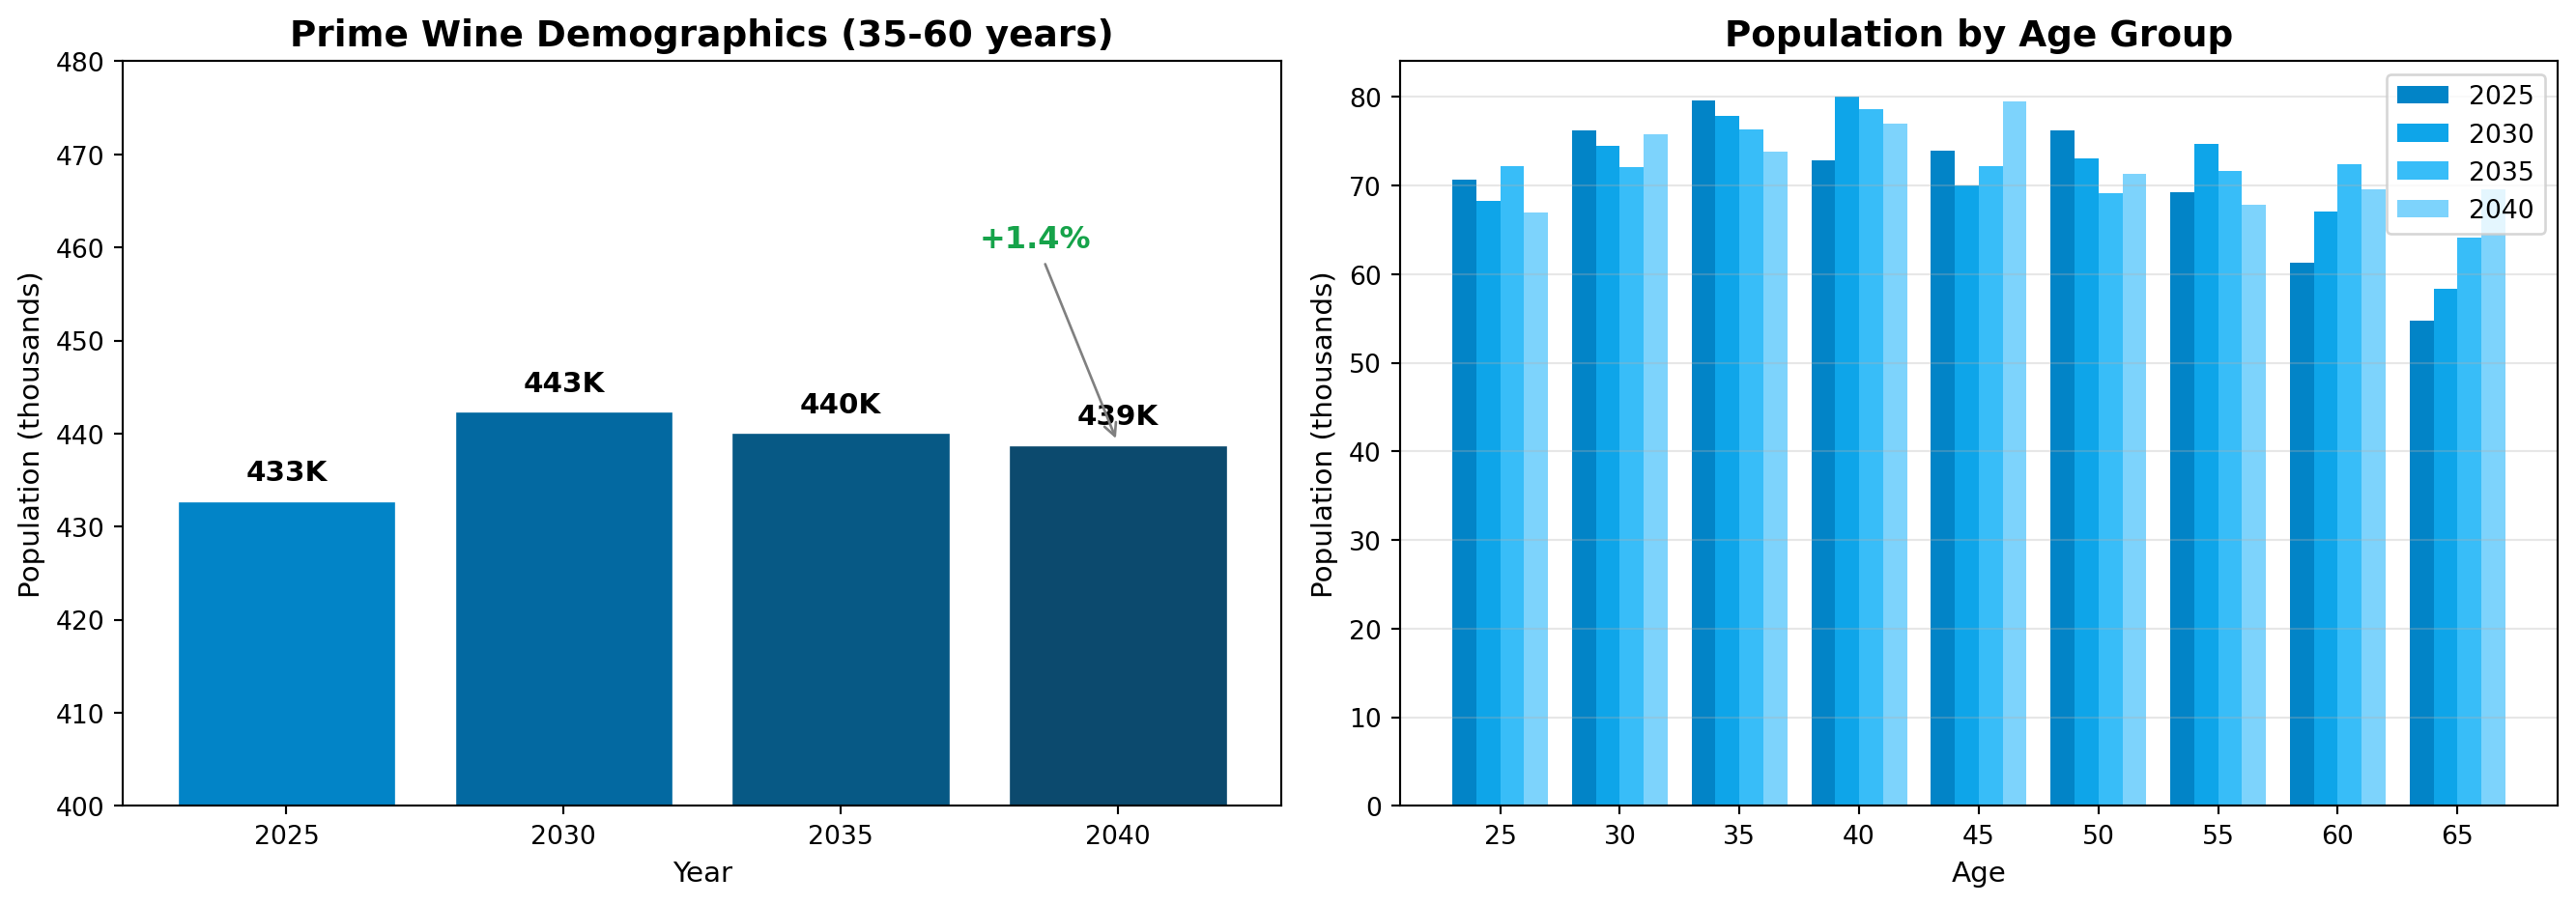
Important📈 Strategic Insight: Demographic Shift
The data shows Norway’s prime wine-drinking demographic (35-60) will:
- Peak around 2030 with ~460,000 people per 5-year cohort
- Decline slightly by 2040 as baby boomers age out
Implication: The domestic market has ~5 years of demographic tailwind before it plateaus. Consider: - Premium positioning now while the market is growing - Building brand loyalty with 35-45 year olds who will remain customers for decades
10.4.3 Try It Yourself
10.5 3. Alcohol Consumption by Demographics
Table 14448: Bruk av alkohol, cannabis og vanedannende legemidler
Population: Ages 16-79
Metrics: Weekly drinking, heavy drinking episodes
By: Age group, gender, education level
10.5.1 Why This Matters
Understanding who drinks and how often helps you: - Target marketing to high-consumption segments - Identify underserved demographics - Track changing consumption patterns
10.5.2 Real Data: Weekly Alcohol Consumption by Age (2023-2025)
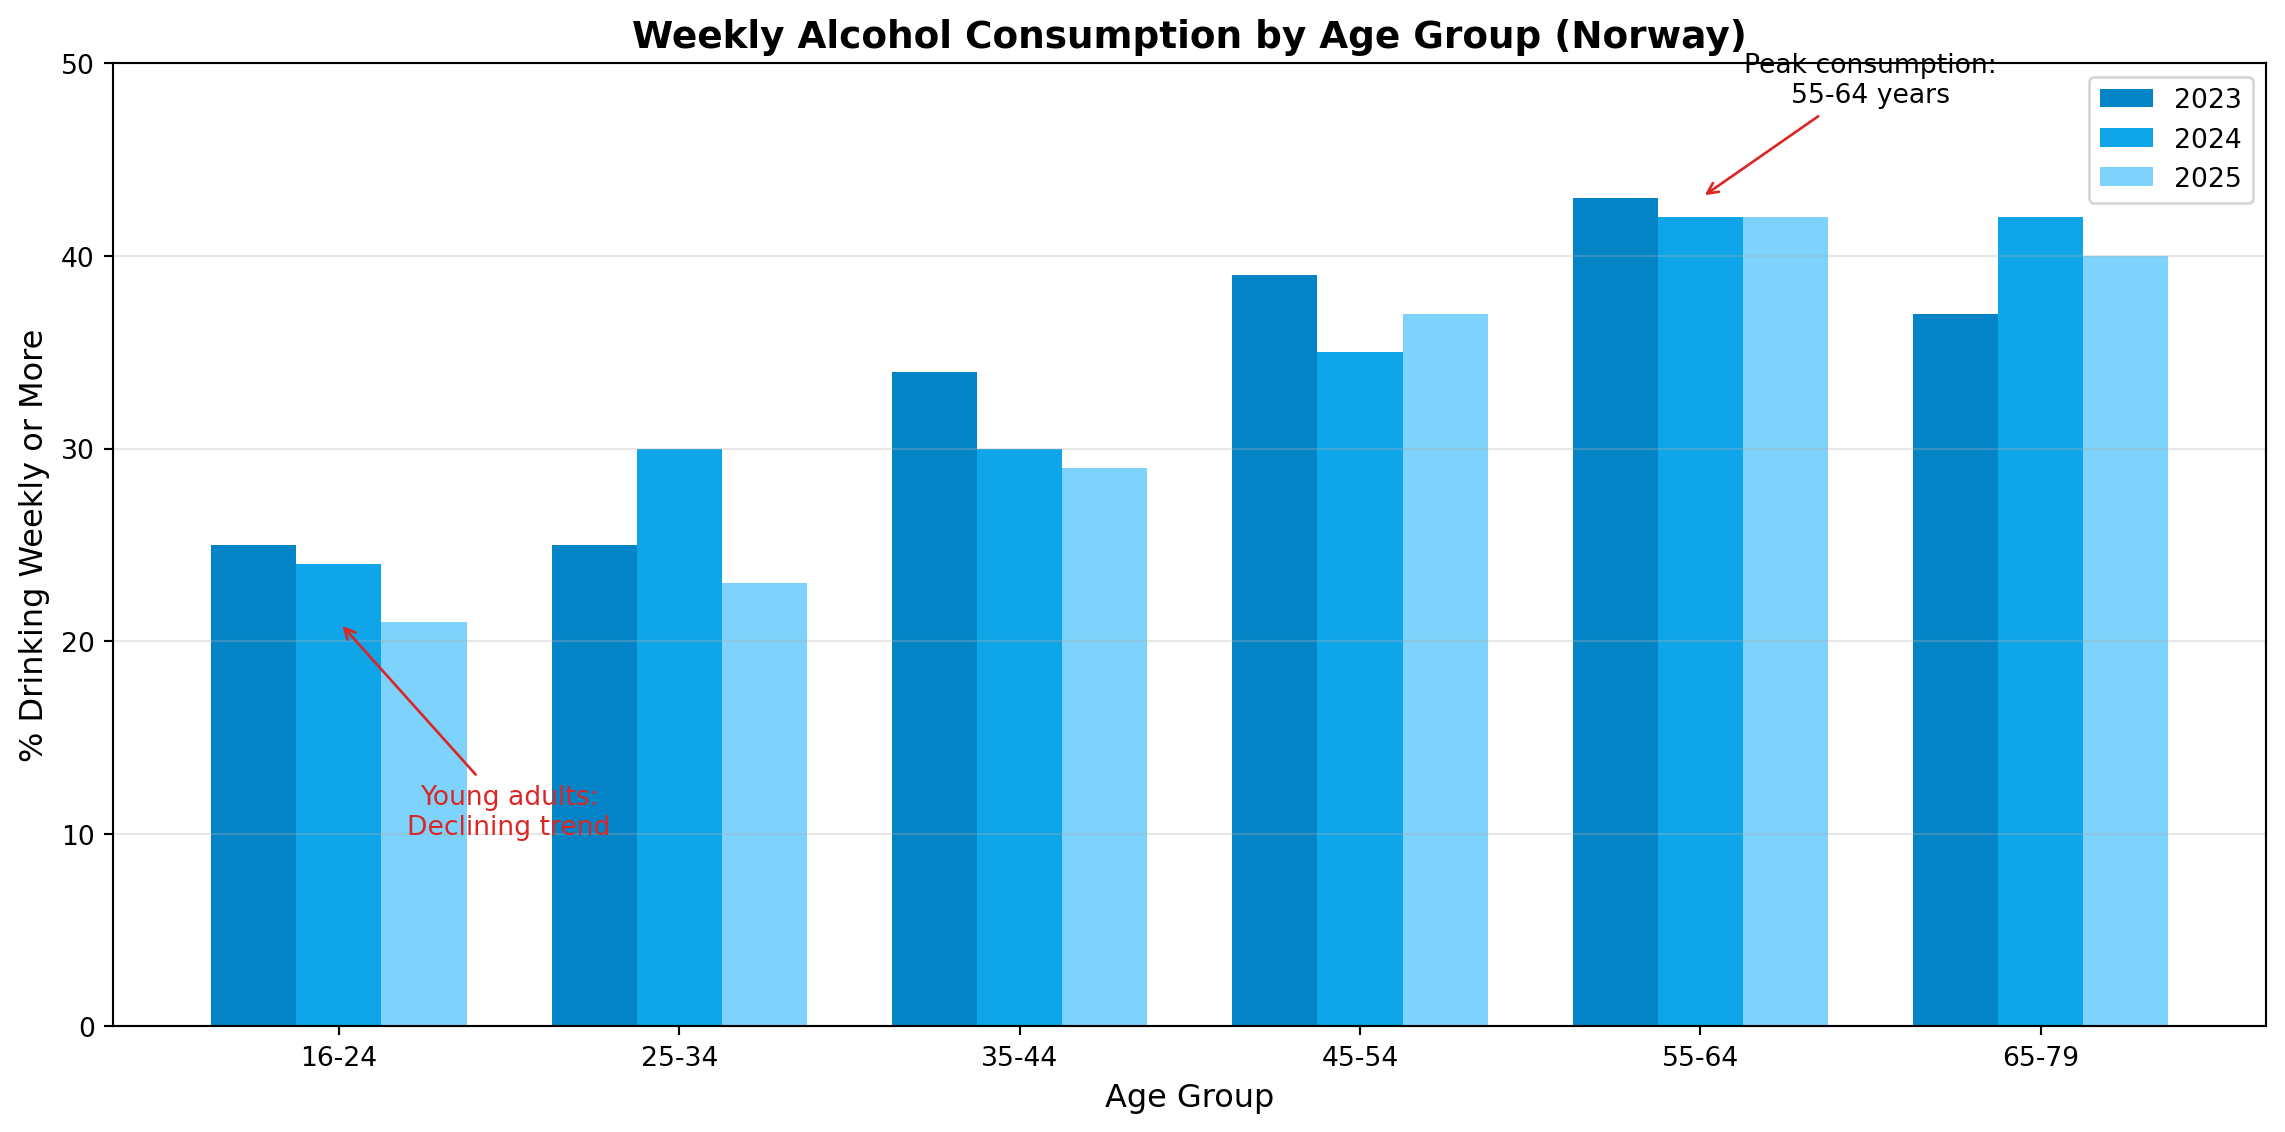
10.5.3 🔍 Key Findings
| Age Group | Pattern | Strategic Implication |
|---|---|---|
| 16-24 | Declining (25% → 21%) | Young adults drinking less - health trends |
| 25-34 | Volatile | Building careers, families - irregular consumption |
| 35-44 | Stable ~30% | Core customers - focus retention |
| 45-54 | High ~37% | Peak spending power - premium positioning |
| 55-64 | Highest ~42% | Most regular consumers - loyalty programs |
| 65-79 | Stable ~40% | Established habits - quality over quantity |
Strategic Action: Your best ROI is in the 45-64 demographic - they drink most frequently AND have highest disposable income.
10.5.4 Try It Yourself
10.6 4. Cross-Nordic Comparison
The Nordic Statistics MCP covers five countries. This enables competitive intelligence across markets.
10.6.1 Querying Different Regions
# Norway (default)
"Search SSB for alcohol statistics tables"

# Sweden
"Search Swedish statistics (SCB) for alkohol tables"

# Denmark
"Search Danish statistics (DST) for alcohol consumption"

# Finland
"Search Statistics Finland (StatFI) for alcohol data"

# Iceland
"Search Hagstofa (Iceland) for alcohol statistics"
Tip🌍 Cross-Border Intelligence
Compare alcohol policies and consumption across Nordic markets to: - Identify expansion opportunities - Understand price sensitivity (Sweden has Systembolaget, Norway has Vinmonopolet) - Track border trade impacts (Swedish border shopping)
10.7 Practical Prompts for Brand Managers
10.7.1 📊 Market Sizing
10.7.2 🏛️ Tax & Policy
10.7.3 👥 Consumer Behavior
10.7.4 📈 Forecasting
10.8 Summary: Data You Can’t Get From SalesVP
| Data Type | SSB Table | Business Value |
|---|---|---|
| Alcohol Tax Revenue | 07107 | Policy risk, market sizing |
| Population by Age | 13599 | Long-term market forecasting |
| Consumption Frequency | 14448 | Targeting, segment sizing |
| Import/Export by Country | 08801 | Competitive intelligence |
| Consumer Expenditure | 10235 | Share of wallet analysis |
Important🎯 Key Takeaway
SalesVP tells you what happened. Nordic Statistics helps you understand why it happened and what will happen next.
Use this data for: - Annual planning and forecasting - Board presentations with macro trends - Pricing strategy (tax trends) - Long-term market sizing - Competitive intelligence
10.9 Next Steps
Now that you can access government statistics for strategic decisions, continue to:
- Chapter 10: Quantitative Finance — FX hedging and treasury management