Querex Is Now Everywhere You Work
Industrial-Grade Analytics on ChatGPT, Gemini, Microsoft Copilot 365, and Claude — Web & Mobile
Querex MCP servers are now available across every major AI platform — ChatGPT, Google Gemini, Microsoft Copilot 365, and Claude — on both web and mobile. Industrial mathematics, Power BI integration, graph theory, and statistical research are now literally at your fingertips. This walkthrough demonstrates a complete analytical workflow from a mobile phone: connecting to Power BI, querying Vinmonopolet sales data, forecasting with SSA time series, competitive landscape analysis, and Monte Carlo simulation for pricing strategy — all through natural conversation.
1 The Announcement
ChatGPT · Google Gemini · Microsoft Copilot 365 · Claude
Web and mobile. Industrial mathematics, Power BI, graph theory, and statistical research — at your fingertips.
Today we’re announcing that Querex MCP servers are available across all four major AI platforms. This means you can access the same institutional-grade analytics whether you’re at your desk, in a meeting, or on the train — from whichever AI assistant you already use.
No installation. No configuration. Just connect and ask.
| Platform | Web | Mobile | MCP Gateway |
|---|---|---|---|
| ChatGPT | ✅ | ✅ | ✅ |
| Google Gemini | ✅ | ✅ | ✅ |
| Microsoft Copilot 365 | ✅ | ✅ | ✅ |
| Claude | ✅ | ✅ | ✅ |
1.1 What’s Available Everywhere
- Power BI Integration — Connect to your semantic models, query DAX, explore schemas
- Industrial Mathematics — Linear programming, constraint programming, vehicle routing, bin packing
- Statistical Research — Hypothesis testing, regression, time series, clustering
- Graph Theory — Network analysis, community detection, centrality metrics
- Revenue Growth Management — Price elasticity, Monte Carlo simulation, scenario analysis
- Nordic Statistics — Live data from SSB, SCB, StatFI, DST, Hagstofa
2 Live Demo: Mobile Analytics Workflow
To show what this looks like in practice, here’s a complete analytical session conducted entirely from a mobile phone. The conversation moves from connecting to Power BI, through sales analysis and forecasting, to competitive intelligence and Monte Carlo pricing simulation — all in about 15 minutes.
2.1 Step 1: Connecting to Power BI
The workflow starts with a simple request: “Connect to Power BI.”
The system initiates a device code authentication flow — standard OAuth. You visit microsoft.com/devicelogin, enter the code, and you’re in.
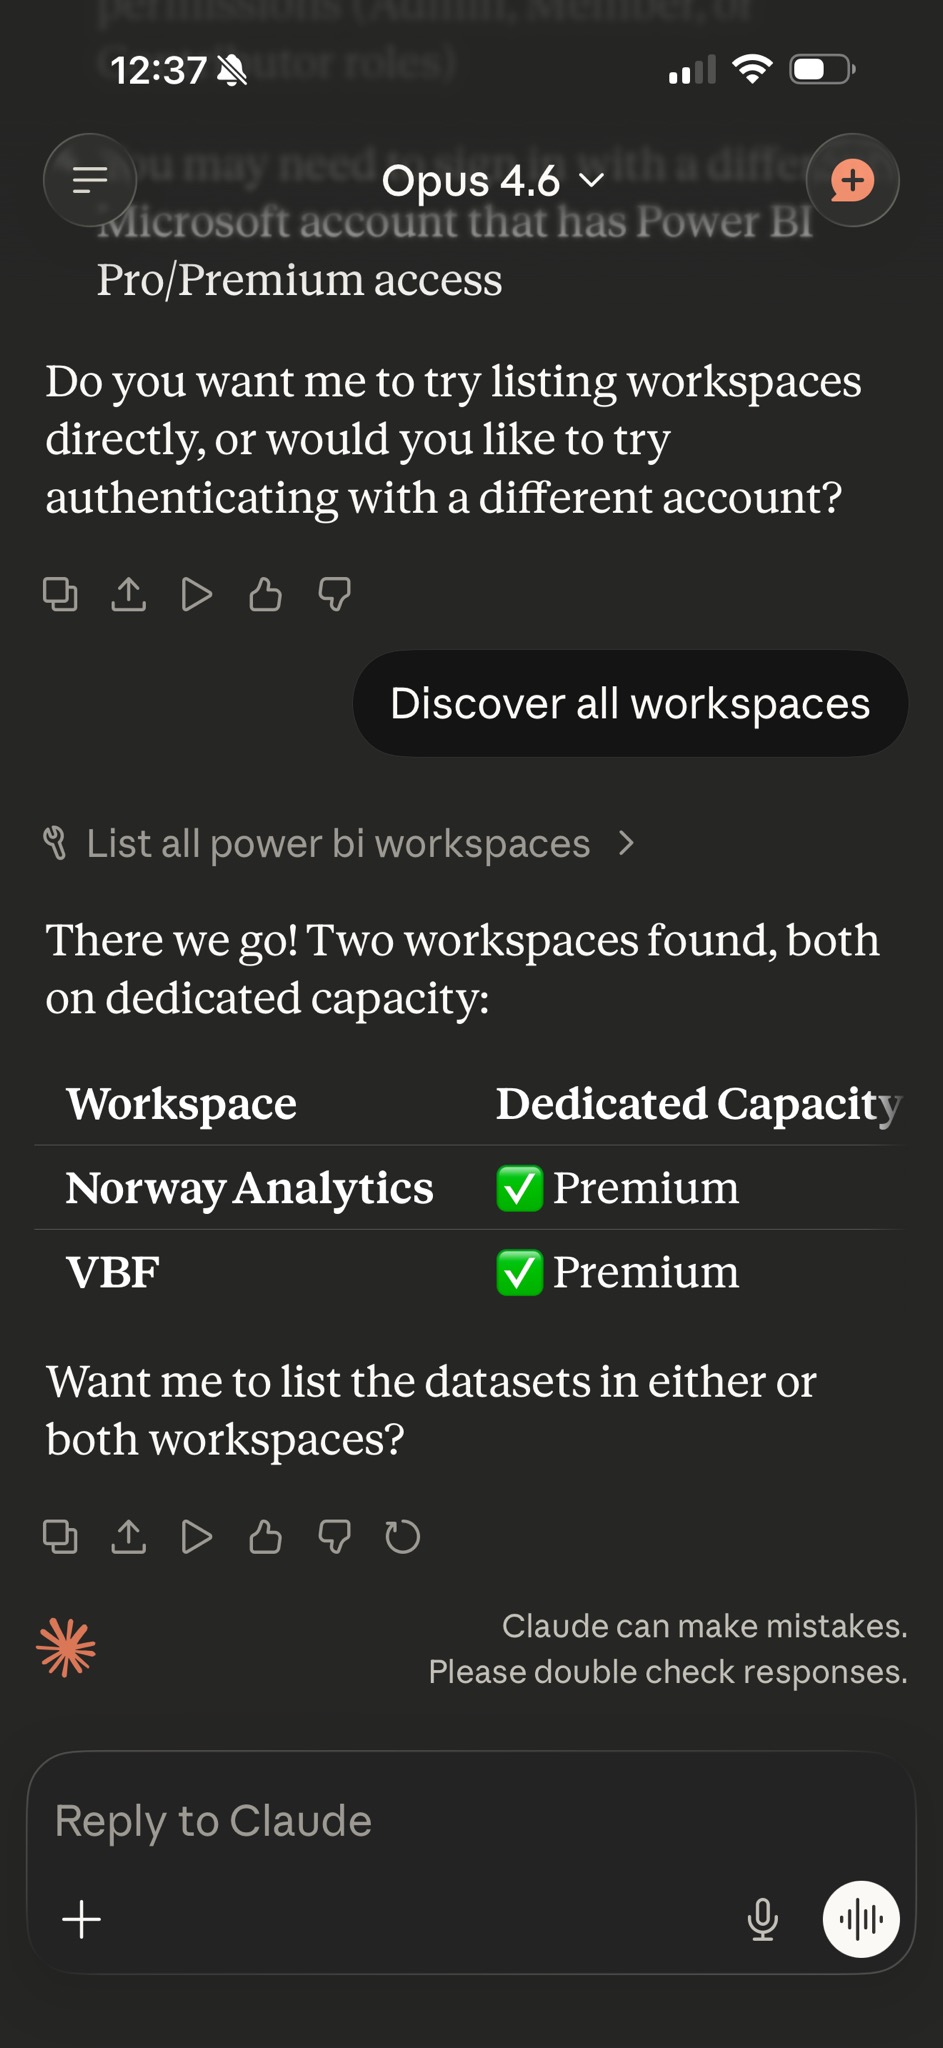
| Workspace | Dedicated Capacity |
|---|---|
| Norway Analytics | ✅ Premium |
| VBF | ✅ Premium |
Both workspaces are on Premium capacity, which means full DAX query support through the XMLA endpoint.
2.2 Step 2: Querying Sales Data — “How much did Absolut Vodka sell in 2024?”
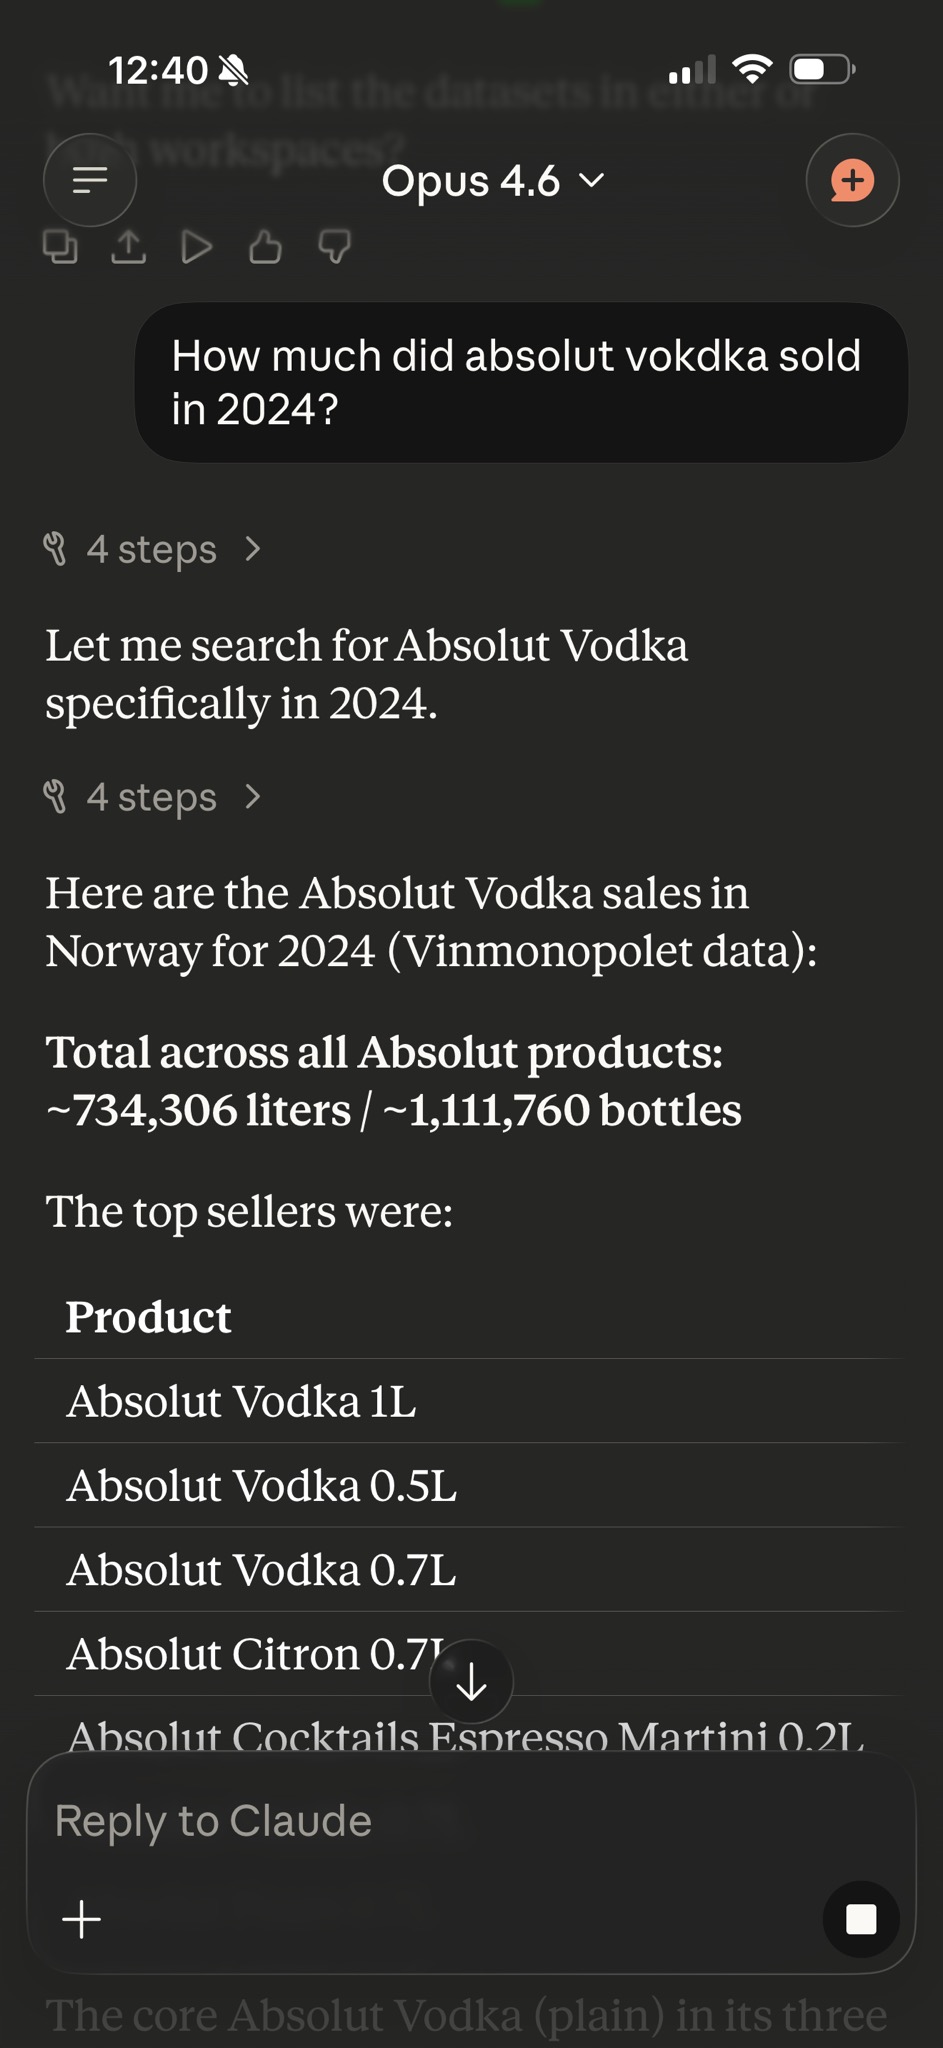
With the connection established, the first question is a business one: “How much did Absolut Vodka sell in 2024?”
The AI connects to the Vinmonopolet semantic model, writes the appropriate DAX query, and returns granular results by product variant.
| Product | Liters | Bottles |
|---|---|---|
| Absolut Vodka 1L | 366,553 | 366,552 |
| Absolut Vodka 0.5L | 151,578 | 303,156 |
| Absolut Vodka 0.7L | 122,158 | 174,512 |
| Absolut Citron 0.7L | 41,991 | 59,987 |
| Absolut Cocktails Espresso Martini 0.2L | 10,200 | 50,998 |
| Absolut Vanilia 0.7L | 9,157 | 13,081 |
| Absolut Pears 0.7L | 8,195 | 11,707 |
The core Absolut Vodka (plain) in three sizes accounted for 640,289 liters — 87% of total volume. The 1L bottle is the dominant SKU.
2.3 Step 3: Forecasting 2025 — Time Series with SSA
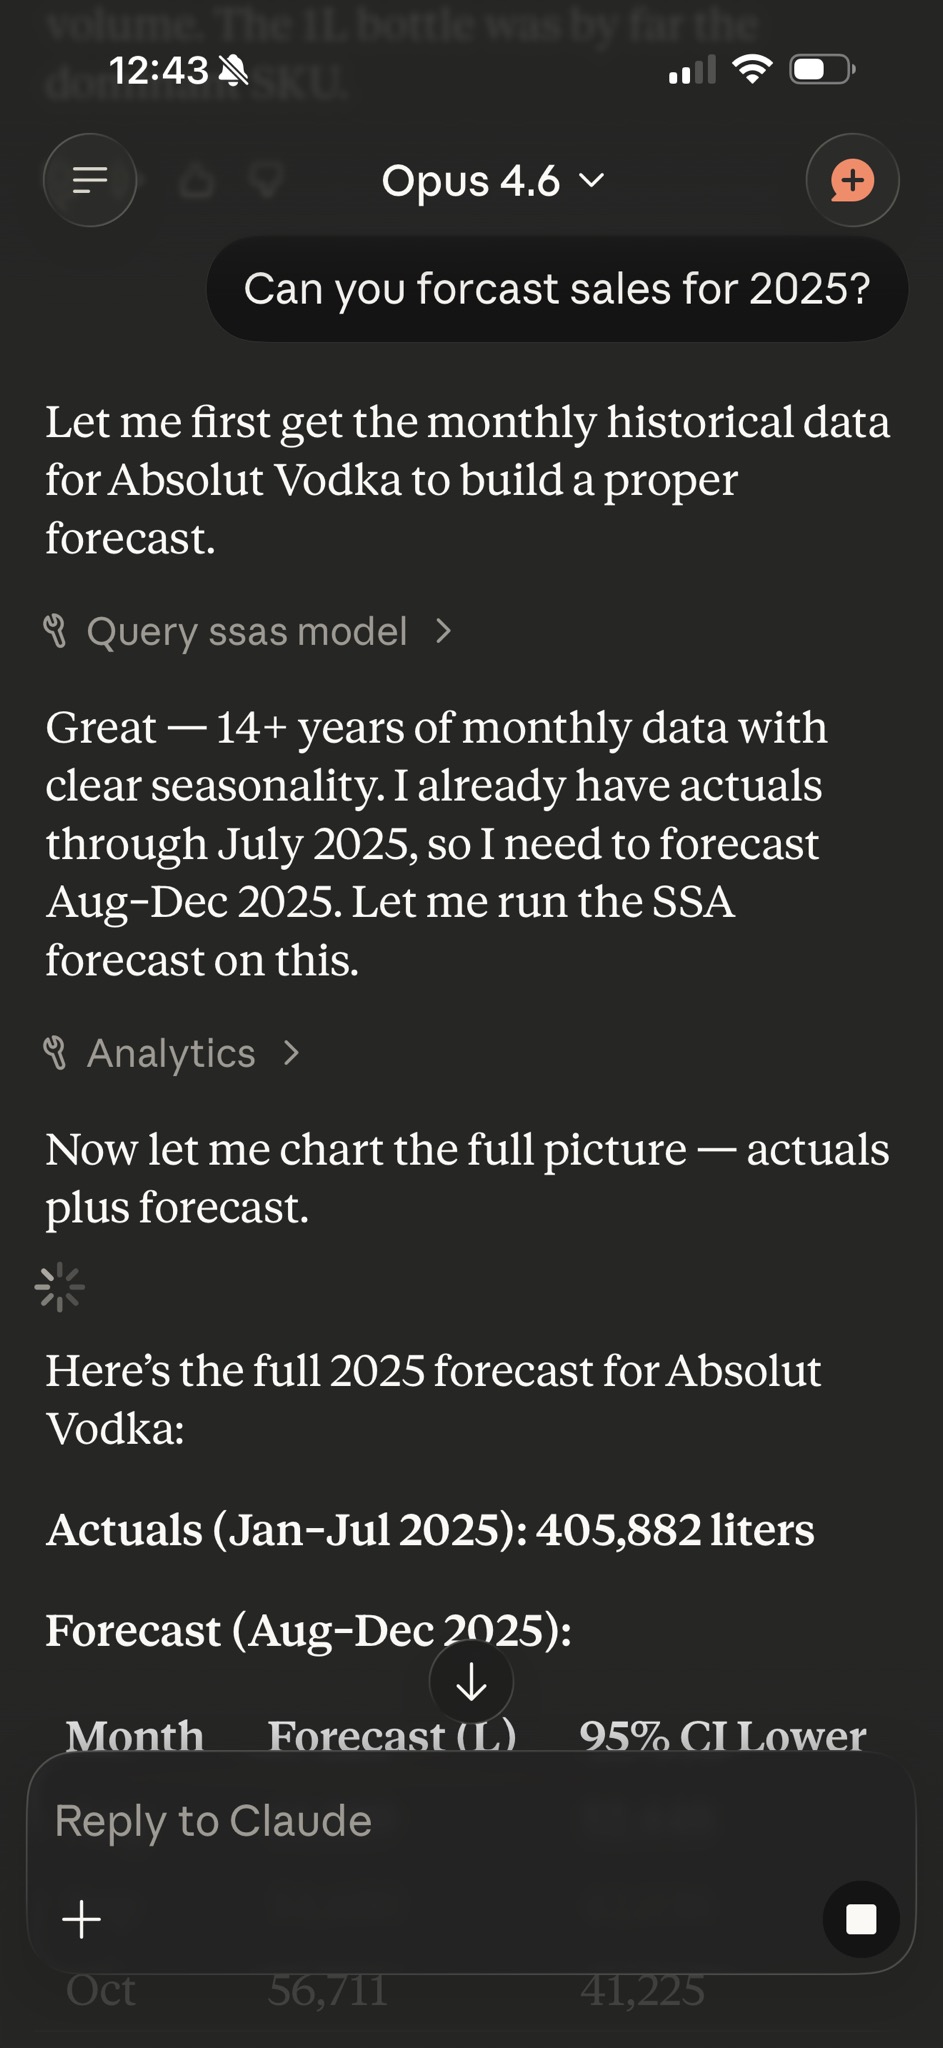
Next question: “Can you forecast sales for 2025?”
The system pulls 14+ years of monthly historical data, identifies the clear seasonal pattern (December spike from Vinmonopolet holiday shopping), and runs a Singular Spectrum Analysis (SSA) forecast for the remaining months of 2025.
Actuals (Jan–Jul 2025): 405,882 liters
| Month | Forecast (L) | 95% CI Lower | 95% CI Upper |
|---|---|---|---|
| Aug | 61,389 | 52,448 | 70,330 |
| Sep | 54,680 | 42,036 | 67,325 |
| Oct | 56,711 | 41,225 | 72,197 |
| Nov | 55,885 | 38,003 | 73,767 |
| Dec | 79,910 | 59,917 | 99,902 |
The December spike is the dominant seasonal pattern — consistent across all 14 years. The COVID years (2020–2021) created an anomalous spike that has been normalizing since 2022.
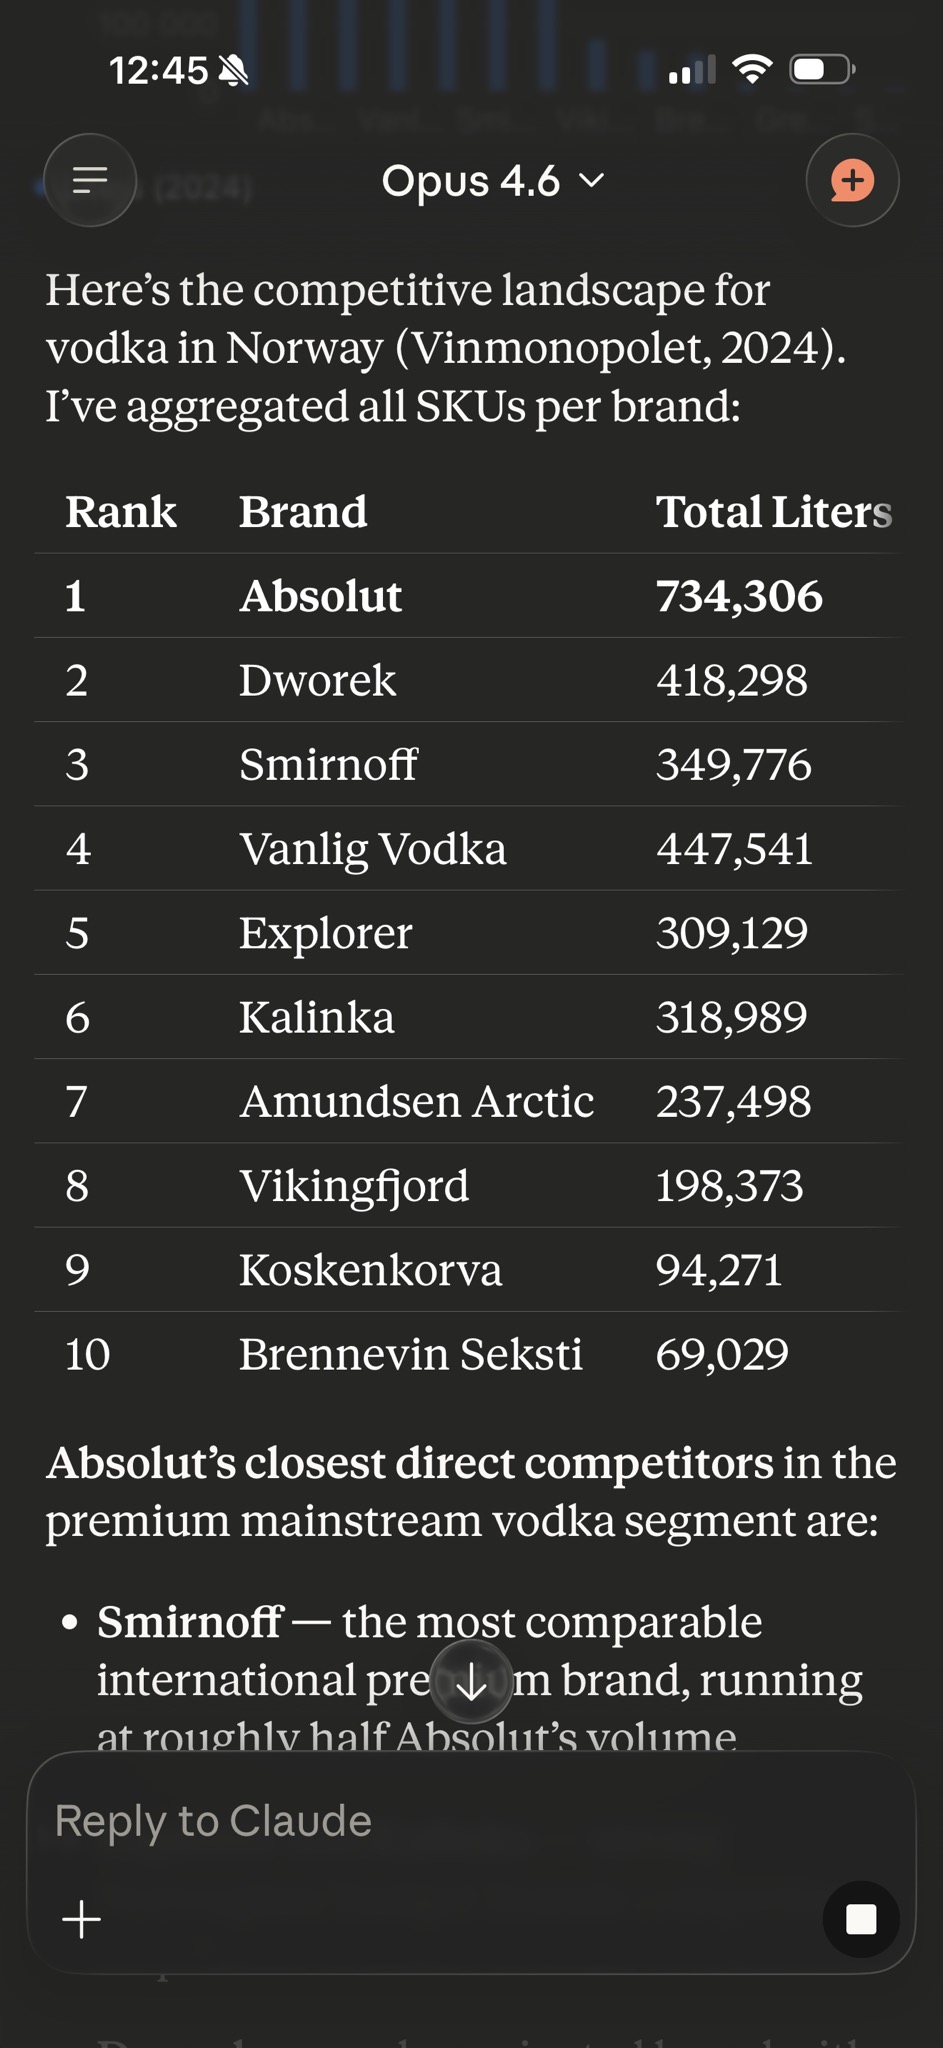
2.4 Step 4: Competitive Landscape — “Who are the closest competitors?”
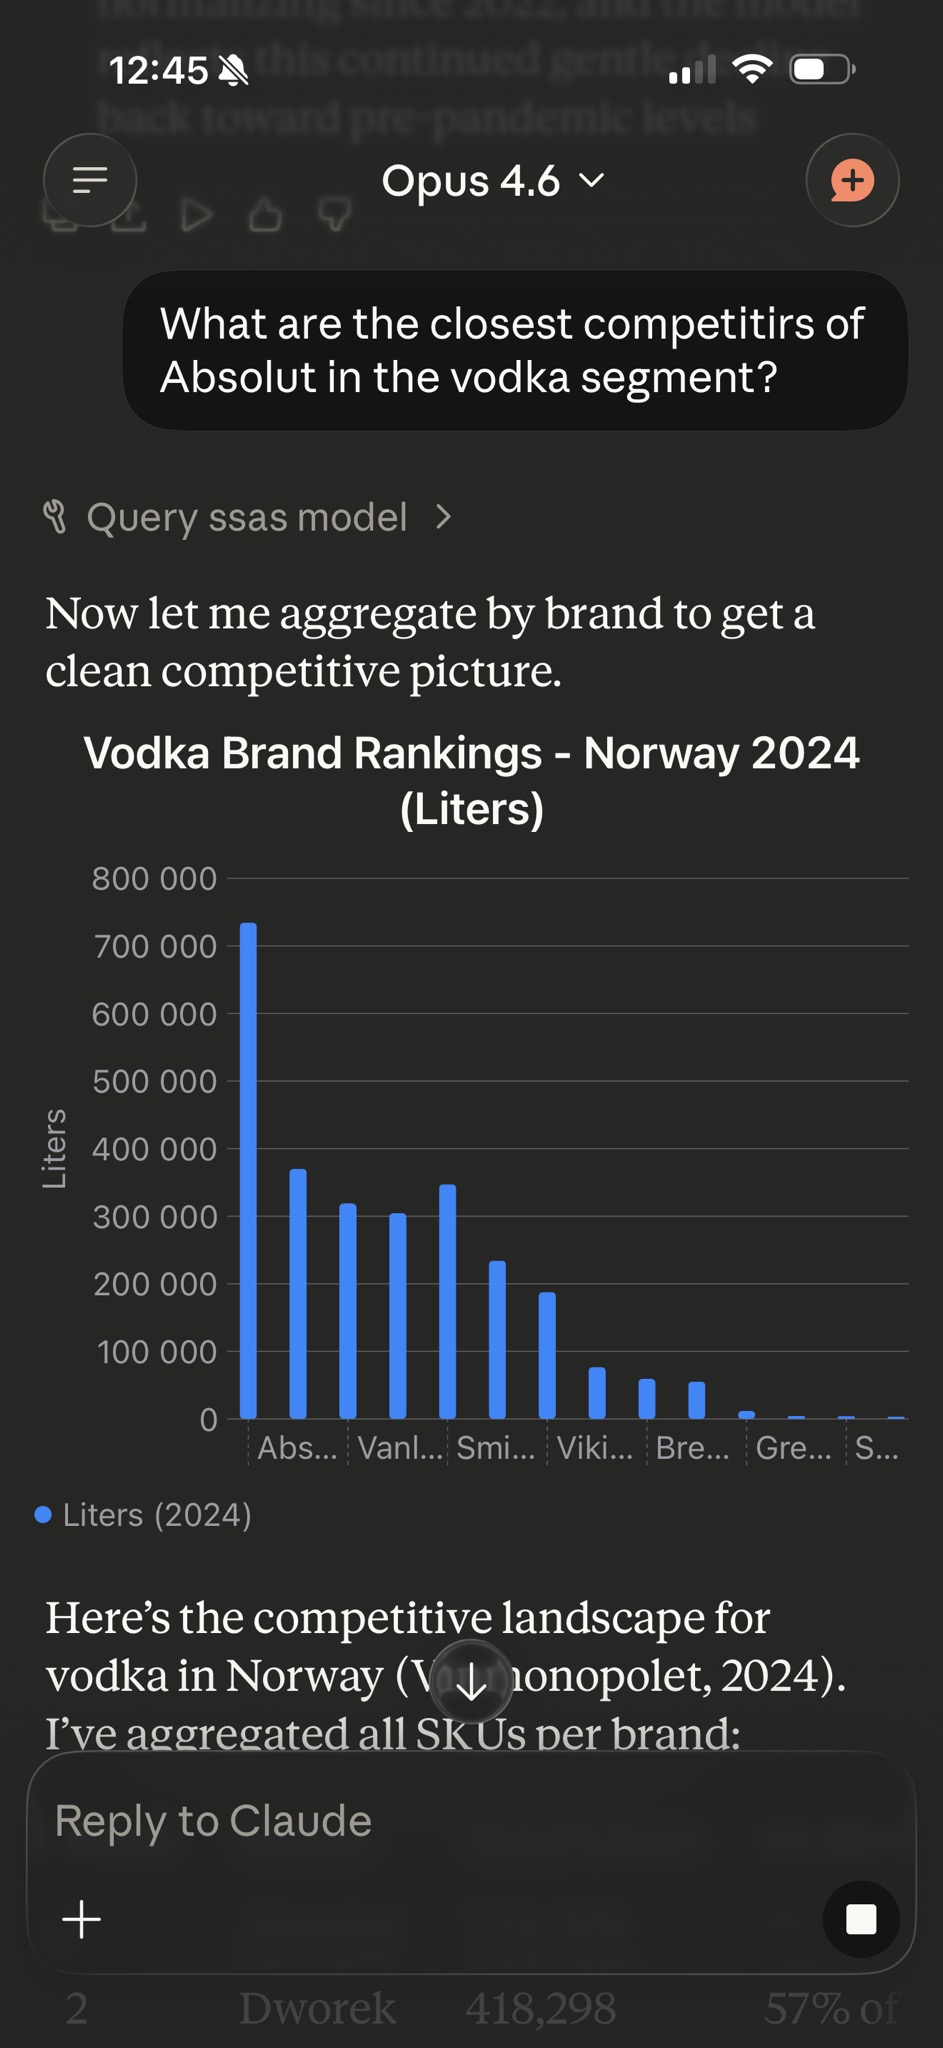
“What are the closest competitors of Absolut in the vodka segment?”
The system queries the full vodka category, aggregates by brand, and ranks them against Absolut.
| Rank | Brand | Total Liters | vs Absolut |
|---|---|---|---|
| 1 | Absolut | 734,306 | — |
| 2 | Vanlig Vodka | 447,541 | 61% |
| 3 | Dworek | 418,298 | 57% |
| 4 | Smirnoff | 349,776 | 48% |
| 5 | Kalinka | 318,989 | 43% |
| 6 | Explorer | 309,129 | 42% |
| 7 | Amundsen Arctic | 237,498 | 32% |
| 8 | Vikingfjord | 198,373 | 27% |
| 9 | Koskenkorva | 94,271 | 13% |
| 10 | Brennevin Seksti | 69,029 | 9% |
Absolut’s biggest competitive threat comes from the budget segment (Dworek, Vanlig Vodka, Kalinka) rather than premium international brands. In the premium tier, Smirnoff is the only real challenger — and Absolut outsells it roughly 2:1.
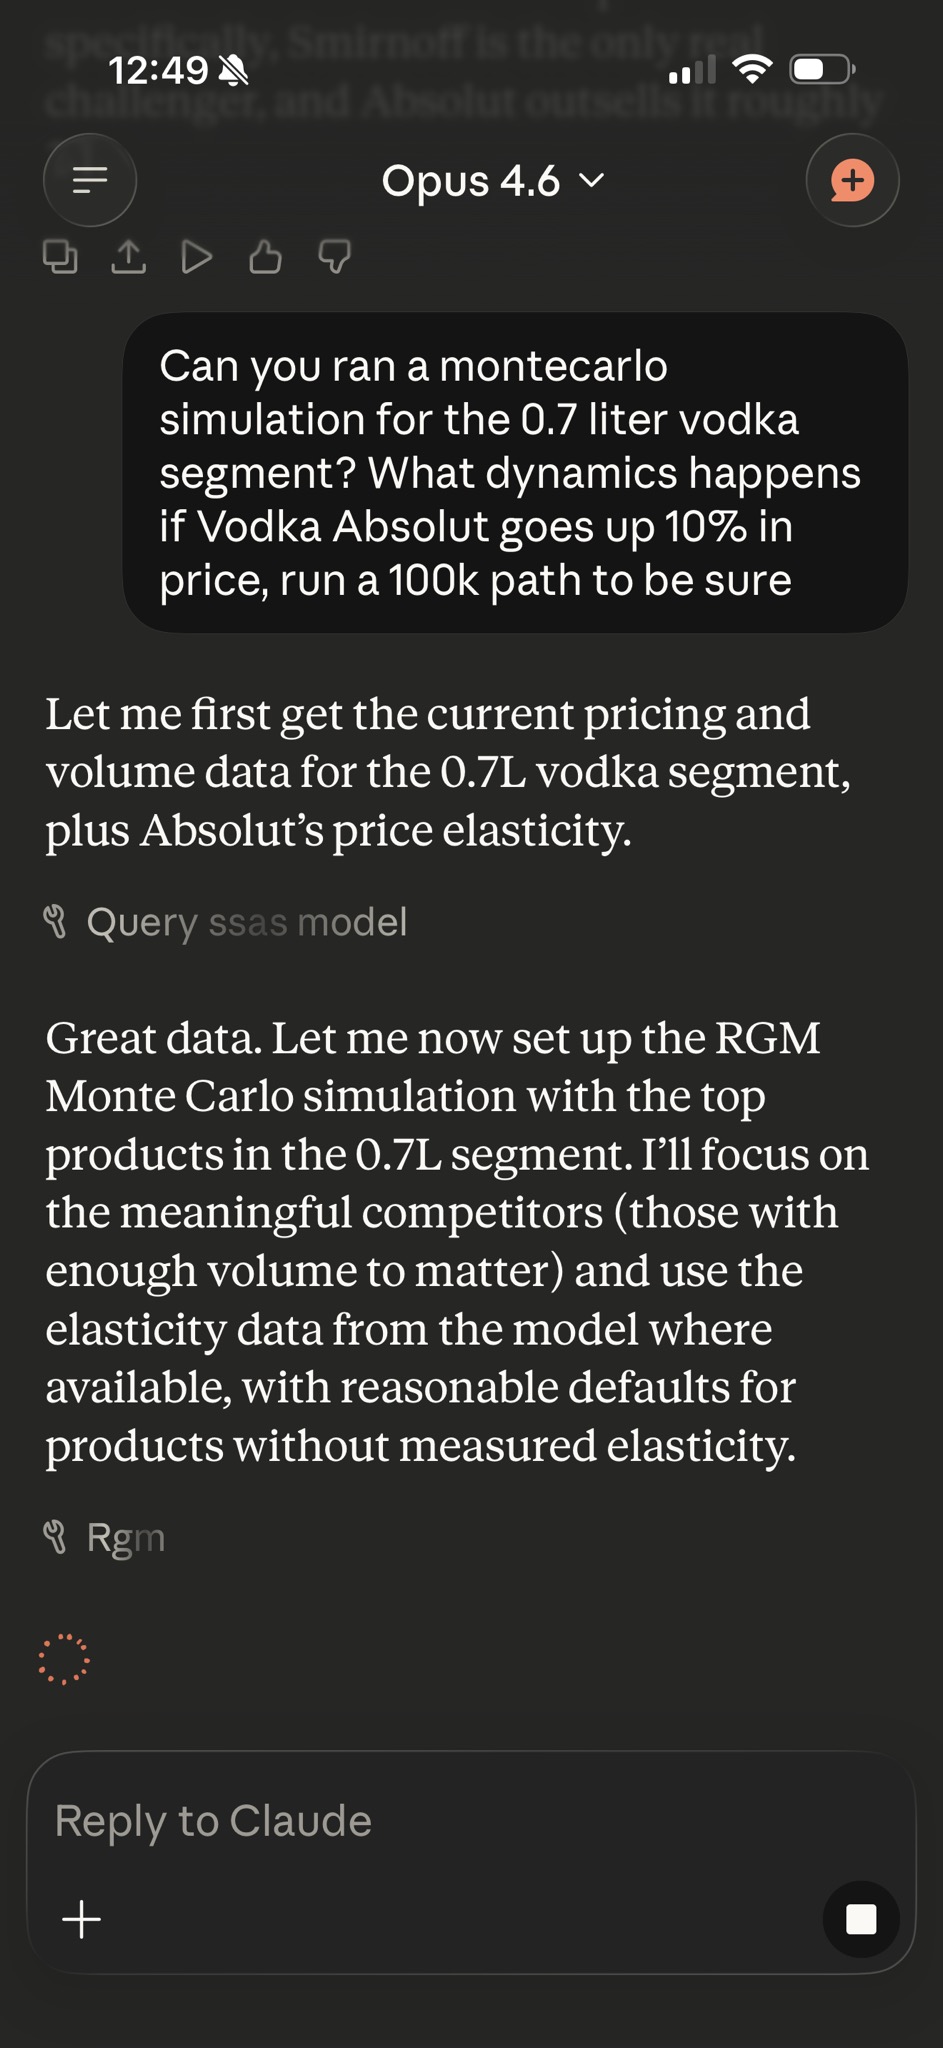
2.5 Step 5: Monte Carlo Simulation — “What if Absolut raises price 10%?”
The final question brings out the heavy artillery: “Can you run a Monte Carlo simulation for the 0.7L vodka segment? What happens if Absolut goes up 10% in price? Run 100K paths.”
This triggers a full Revenue Growth Management (RGM) simulation with:
- Price elasticity modeling across the competitive set
- Cross-elasticity substitution effects
- 100,000 stochastic scenarios
- NPV and risk-adjusted return calculations
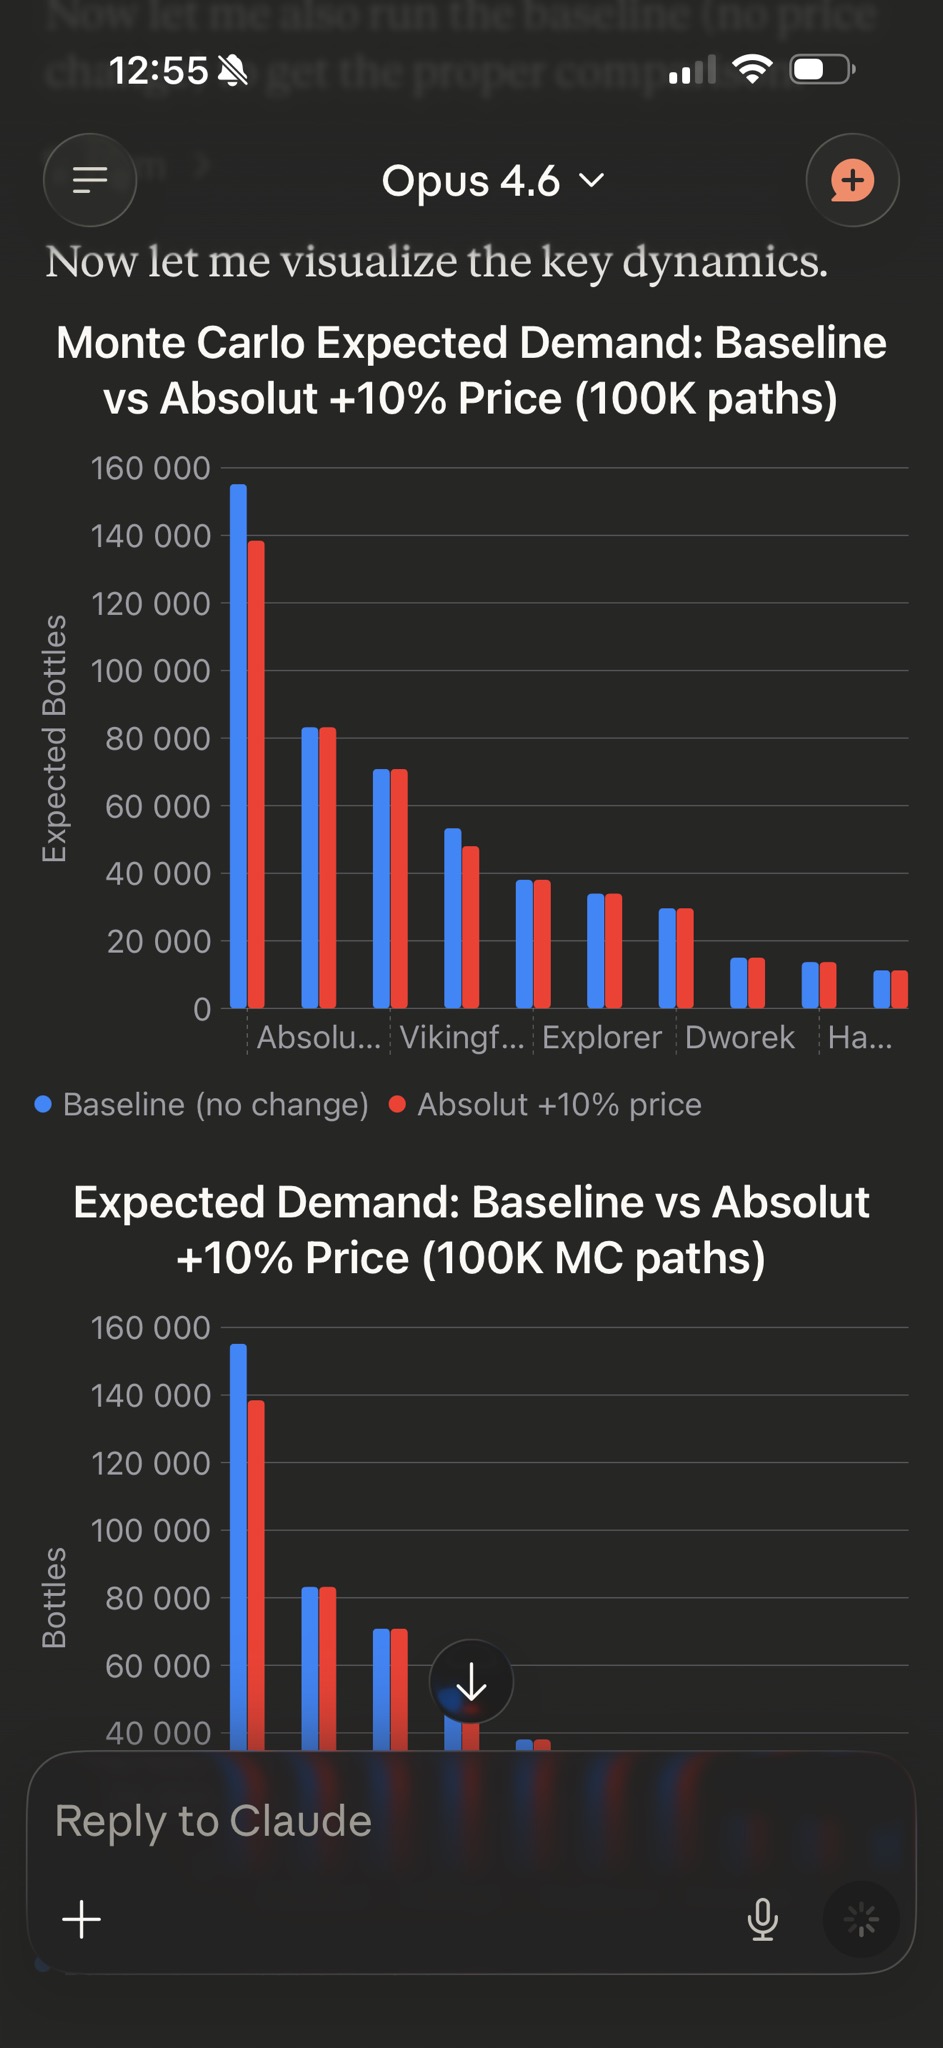
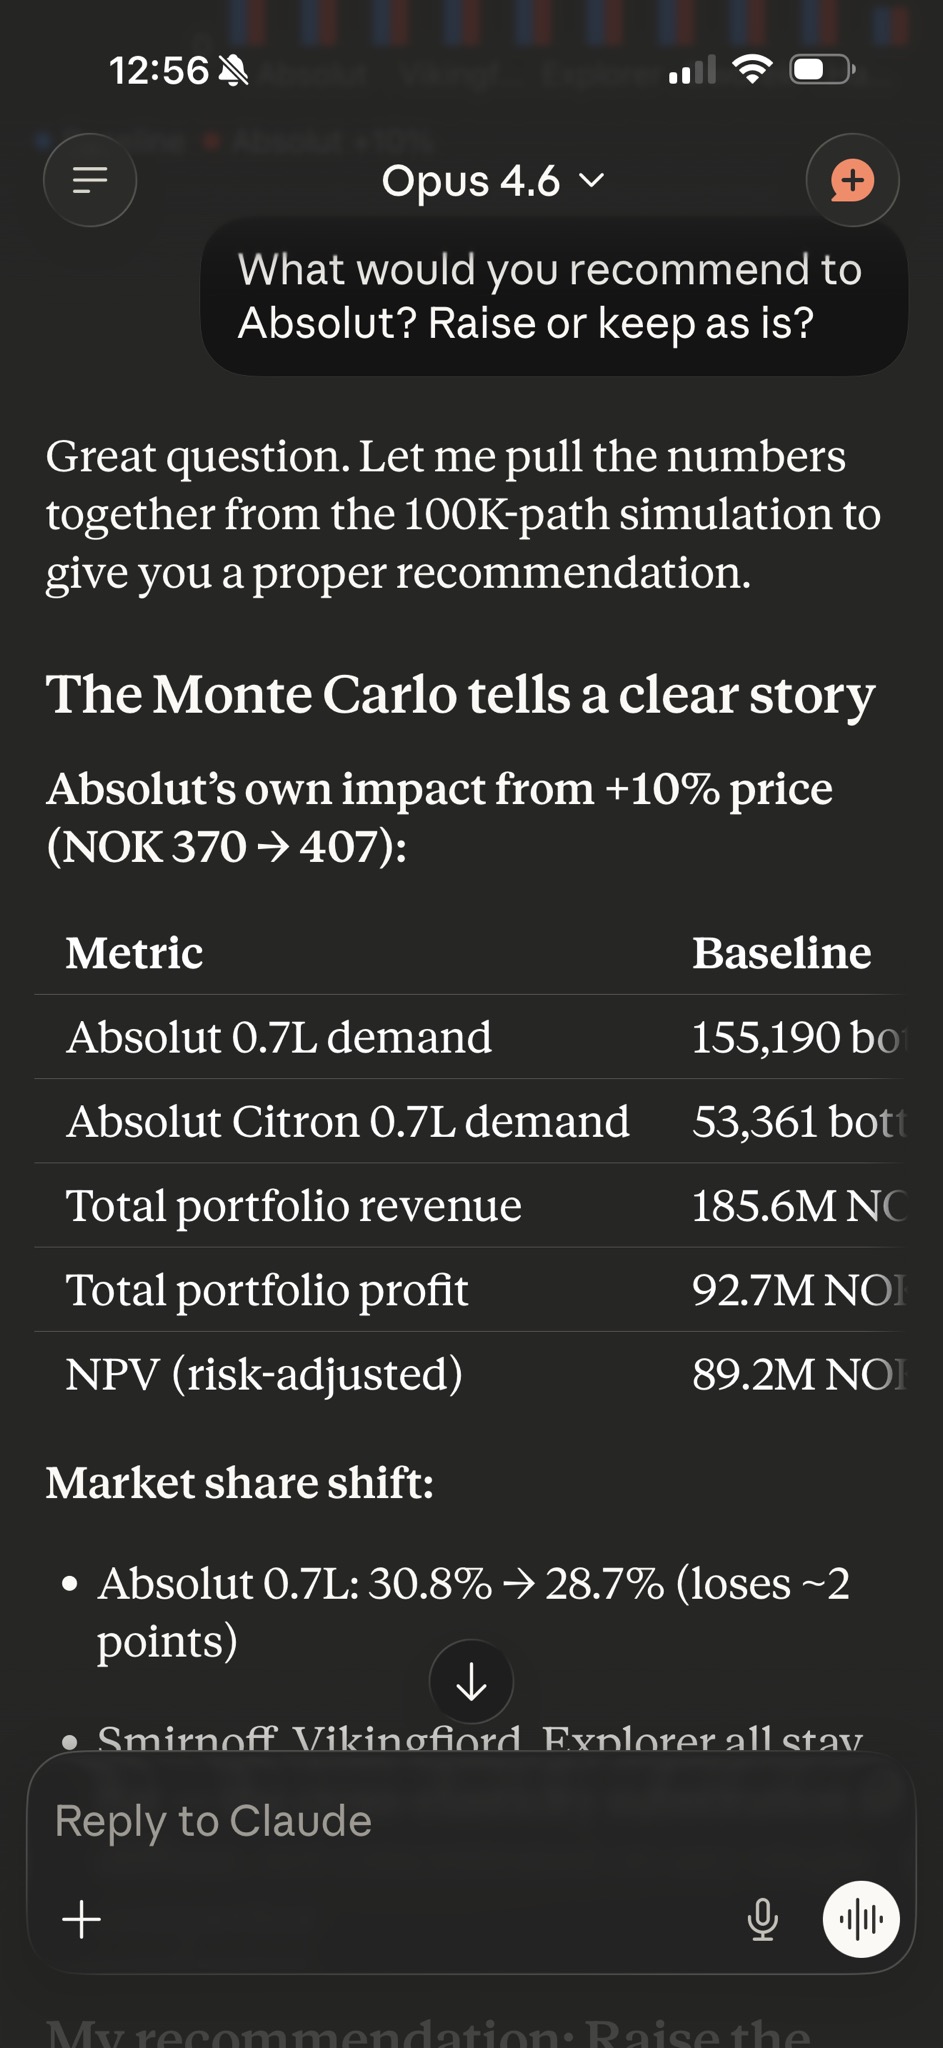
| Metric | Baseline | +10% Price | Delta |
|---|---|---|---|
| Absolut 0.7L demand | 155,190 bottles | 138,425 bottles | −10.8% |
| Absolut Citron 0.7L demand | 53,361 bottles | 48,051 bottles | −9.9% |
| Total portfolio revenue | 185.6M NOK | 184.3M NOK | −0.7% |
| Total portfolio profit | 92.7M NOK | 95.6M NOK | +3.1% |
| NPV (risk-adjusted) | 89.2M NOK | 91.9M NOK | +3.0% |
Market share shift: Absolut 0.7L drops from 30.8% → 28.7% (−2 points), but the substitution is diffuse — spread thinly across 8+ competitors rather than flowing to a single rival.
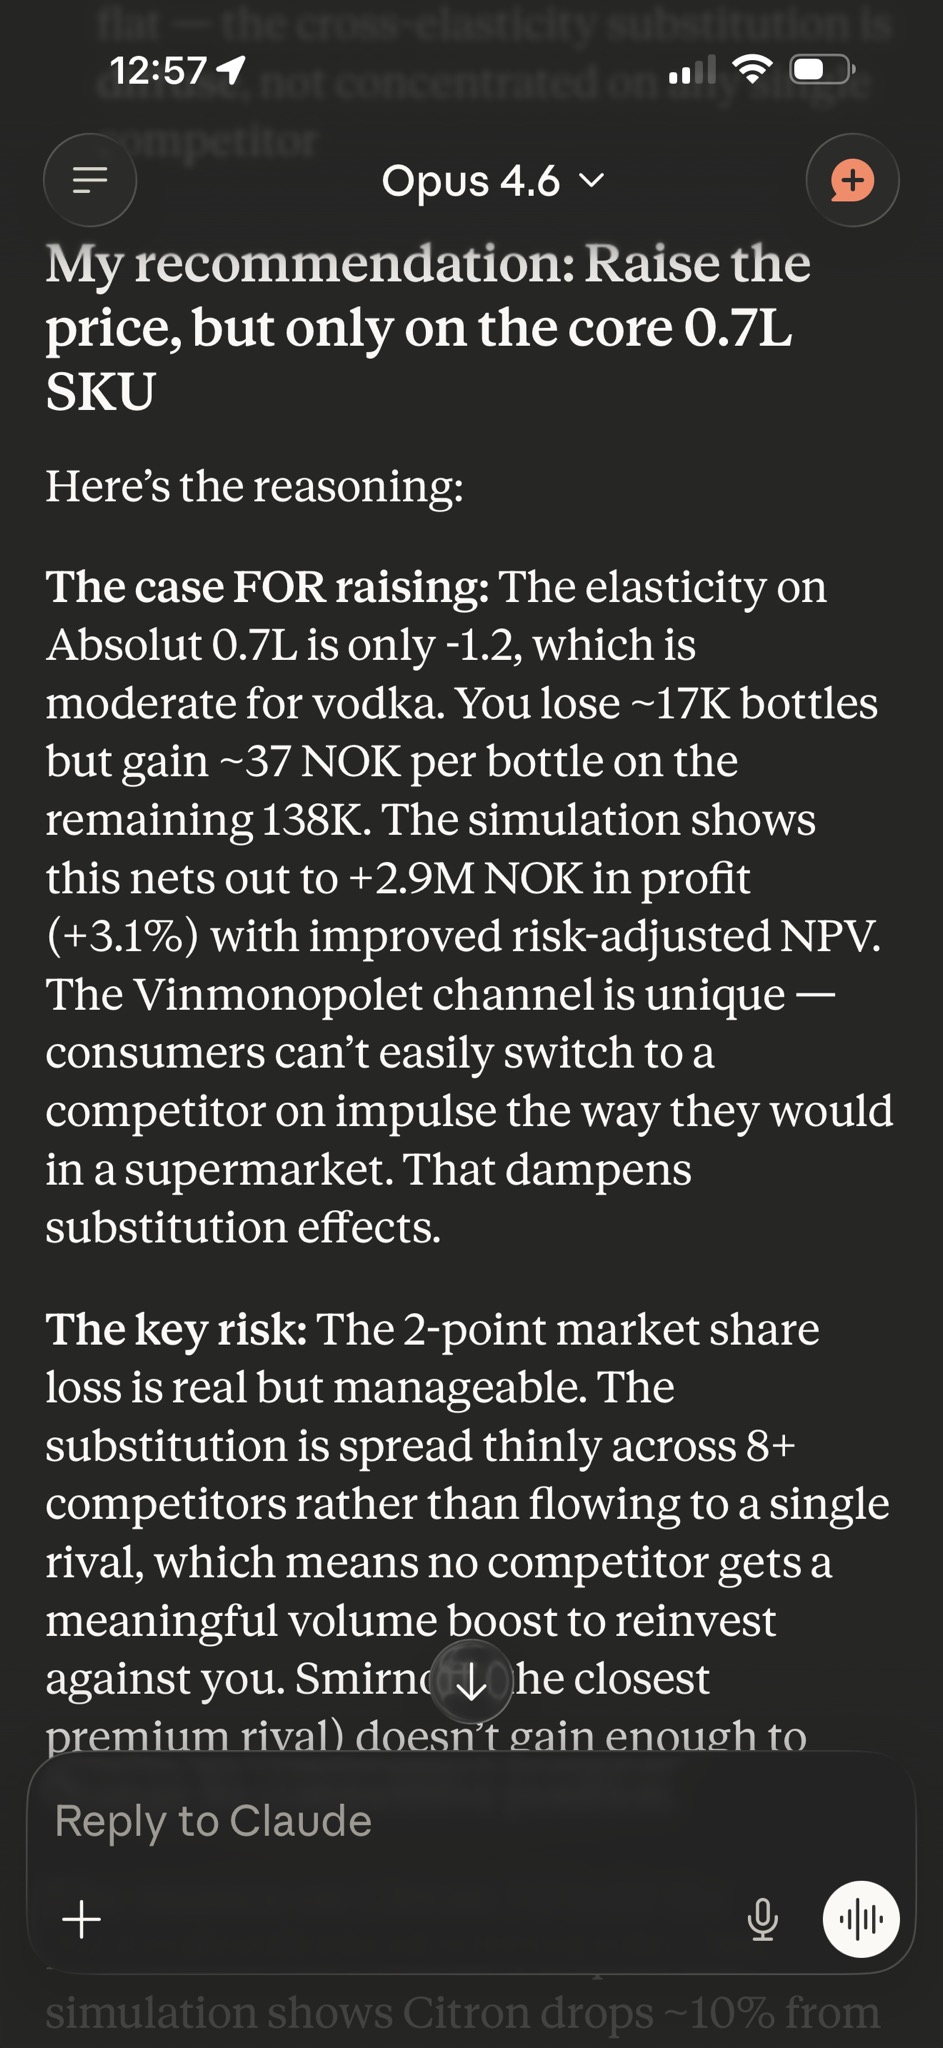
2.6 The Strategic Recommendation
The case FOR raising: Elasticity on Absolut 0.7L is −1.2 (moderate for vodka). You lose ~17K bottles but gain ~37 NOK per bottle on the remaining 138K. The simulation shows +2.9M NOK in profit (+3.1%) with improved risk-adjusted NPV. The Vinmonopolet channel is unique — consumers can’t easily switch on impulse the way they would in a supermarket.
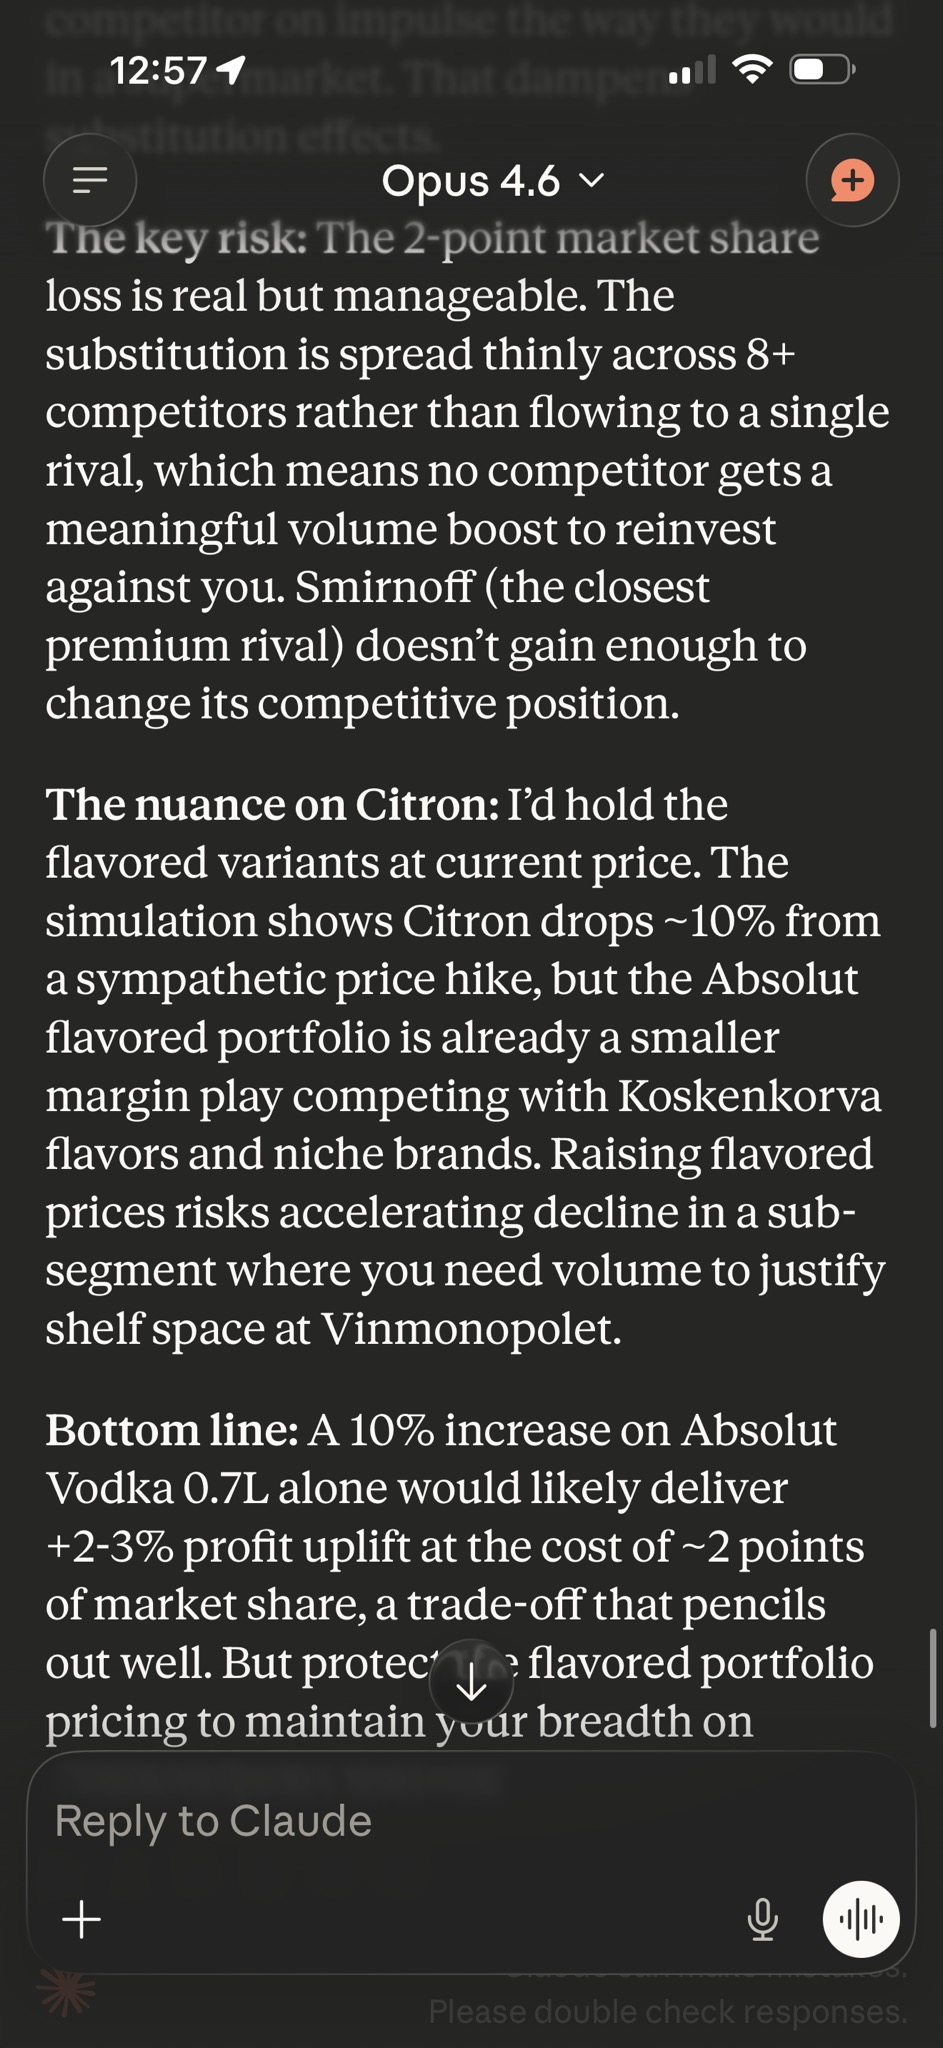
The key risk: The 2-point market share loss is real but manageable. The substitution is spread thinly across 8+ competitors, so no single rival gets a meaningful volume boost.
The nuance on Citron: Hold flavored variants at current price. Citron drops ~10% from a sympathetic price hike, but the flavored portfolio competes with Koskenkorva flavors and niche brands. Raising flavored prices risks accelerating decline in a sub-segment where volume justifies shelf space.
Bottom line: A 10% increase on Absolut Vodka 0.7L alone would deliver +2-3% profit uplift at the cost of ~2 points of market share — a trade-off that pencils out well.
3 What This Means
This entire workflow — Power BI authentication, DAX queries, 14 years of time series forecasting, competitive brand analysis, and 100,000-path Monte Carlo simulation — was conducted from a mobile phone in about 15 minutes.
No Jupyter notebooks. No Python scripts. No data exports. No desktop required.
| Capability Used | MCP Server |
|---|---|
| Power BI authentication & DAX queries | Querex MCP Gateway |
| SSA time series forecasting | MCP Statistics (Analytics) |
| Competitive landscape aggregation | Querex MCP Gateway |
| Monte Carlo simulation (100K paths) | MCP OR-Tools (RGM) |
| Chart rendering | MCP Statistics (Visualization) |
All five servers worked together seamlessly, orchestrated by natural language. The user never needed to know which tool was being called — they just asked business questions and got answers.
4 Get Started
Querex MCP servers are available today on all four platforms. Whether you’re a data analyst, a brand manager, a financial controller, or a researcher — industrial-grade analytics now goes wherever you go.
Contact: support@querex.no